EverForecast
Predictive Eco-AnalysisFAQ
How do I interpret the forecasts?
EverForecast provides a range of possible future water level conditions across the Everglades to help managers and decision makers plan for near-term environmental change. These forecasts represent a range of possible scenarios. It is likely, but not certain, that real-world values will fall within this range. This modeling approach allows us to incorporate the inherent uncertainty in things like rainfall. Forecasts are not intended to be used to predict specific dates for events such as dry downs or inundation.
Where can I download EverForecast outputs?
You can download EverForecast outputs here: https://s3.amazonaws.com/jem.models.headless/index.html
The data files provided here include output data before summarizing across hydrologic category and Everglades subregion.
What is a Netcdf?
Most EverForecast output is in NetCDF format. The CERP NetCDF standard is an effort by the Joint Ecosystem Modeling (JEM) community to define a data standard to facilitate data sharing among the Scientists in the Everglades area. The standard is derived from the NetCDF Climate and Forecast (CF) conventions. We recommend using the EverVIEW Data Viewer when working with NetCDFs.
Here's a quick guide for opening NetCDF files in EverVIEW:
-
After downloading EverVIEW and extracting all files to your preferred directory, open the executable file “EverVIEW_DataViewer.exe” to open the application. Both the “Introduction” button in the “Welcome” window and Help >> Help Contents will bring you to the application’s help documentation.

-
The button in the upper left-hand corner (circled below) will launch the Dataset Loader Dialog when clicked. With this dialog, you can select a NetCDF (*.nc) to open and display. When the data has been loaded, you can begin to interact with your data. You can use the icons located at the upper right portion of the globe section to open the table and charting views.

-
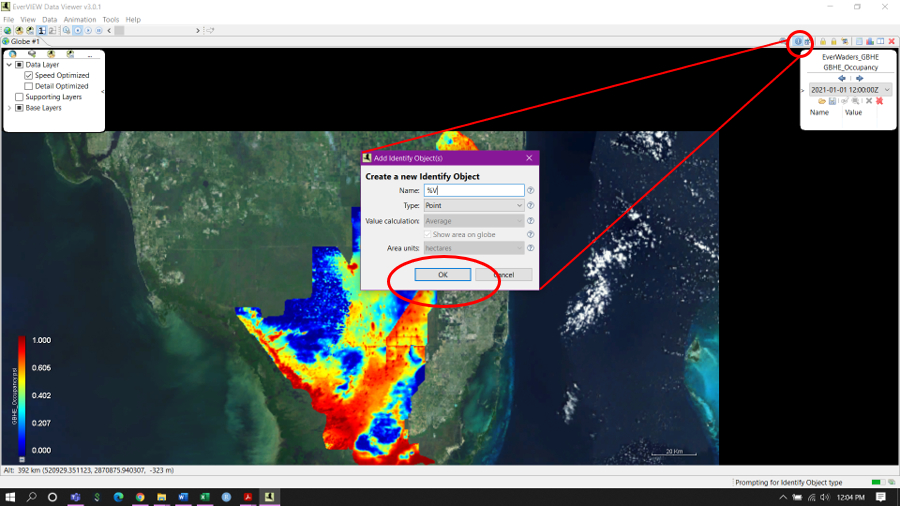
Now you can work with your NetCDF file! With EverVIEW, it is easy to explore your data. For one, you can click on the “i” button in the upper right corner of the window to pull up the “Add Identify Object(s)” window. Click OK.

You can now left-click within your globe view to find the exact value of a point (will be ‘N/A’ if outside of your data).
-
If you load a NetCDF with time series data, you will see the date range in the Data Loader window.

The buttons in the upper left circled below can be used to play through the time series data. You can also navigate through the different time frames using the menu in the widget in the upper right corner.